What is a good sale-to-list price ratio?
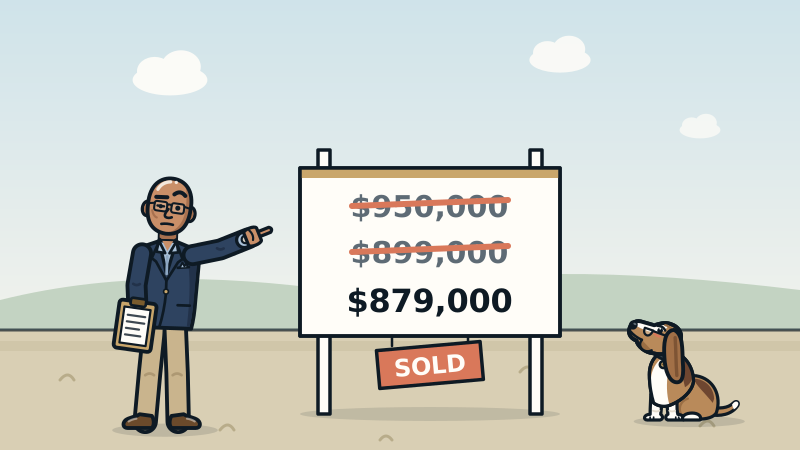
The sale-to-list ratio is the sale price divided by the list price. At 99%, a home sold 1% under asking. NAR's 2025 profile found sellers received a median of 99% of list price. A good ratio is one that matches or beats similar homes in your area right now, measured against the original price too.
How the ratio works
The math is simple enough to do on a napkin at an open house, between cookies.
Take the sale price and divide it by the list price. A home listed at $800,000 that sells for $784,000 has a ratio of 98%. If it sells for $820,000, the ratio is about 102.5%. These are hypothetical numbers, but the formula is the same everywhere.
Redfin calculates its version as an average of each sold home's sale price divided by its final list price. A 99% ratio means the typical home sold 1% under list. Redfin also excludes sales priced 50% or more above or below list, which removes data entry errors and odd transactions that would throw the average off.
Above 100% usually means buyers were competing. Below 100% means buyers negotiated down. Exactly 100% means the seller and the market agreed, which deserves a small celebration and maybe one of those open-house cookies.
One thing the ratio never shows is seller credits. A home that sold at 100% of list with a large credit toward the buyer's closing costs did not really sell for full price. And a credit is not worth dollar for dollar in value either. How the market reacts to credits has to be measured from actual sales, which is why I read the terms of each sale, not only the price line.
What counts as a good ratio
Nationally, NAR's 2025 Profile of Home Buyers and Sellers found that sellers received a median of 99% of their listing price. The same profile reported a median of four weeks on the market, one week longer than the year before.
So 99% is a reasonable national benchmark. It is not a goal for your house.
A good ratio is one that matches or beats what similar homes in your area have been getting lately. In a hot pocket where homes routinely close above list, 99% might mean the house was overpriced. In a slow segment where homes close at 95%, getting 98% might be a win.
The ratio also depends on pricing strategy. Redfin's April 9, 2026 analysis of February sales said low price-cut rates in places like San Francisco and San Jose reflected sellers underpricing homes to encourage bidding wars. Price a house low on purpose and the ratio looks amazing. That does not mean the seller got more money than a well-priced listing would have. It means the list price was set lower.
The catch: final list price versus original list price
Redfin's ratio uses the final list price. That matters more than most people realize.
Picture a house listed at $1,000,000. After two cuts, it is listed at $900,000 and sells for $891,000. Against the final price, that is 99%. Looks great. Against the original price, it is 89.1%. Looks like what actually happened.
If you are a seller judging an agent's track record, ask for both numbers. If you are an agent pricing a listing, look at both on your comps. A neighborhood with high final-price ratios and lots of price cuts is telling you sellers keep starting too high.
Days on market tells the same story from a different angle. A home that sold at 99% of list after a weekend is a different signal than one that sold at 99% of its third list price after four months.
How I use the ratio as an appraiser
For me, the ratio is a tool for reading listings, not a report card.
An active listing is an asking price, not a sale. When I look at a competing listing or a pending sale whose price is not public yet, I estimate where it is likely to close. I measure the sale-to-list ratio on recent sales of similar homes, then apply it to the asking price. If similar homes have closed at about 97% of list, a $900,000 listing points to roughly $873,000.
I also say how many sales that ratio is based on. A ratio from four sales is a hint. A ratio from forty is evidence. Readers deserve to know which one they are looking at.
And I watch for change. If the ratio for the last 45 days is lower than for the last year, the market is cooling in that segment, and the report should say so plainly instead of hiding it in a 12-month average.
How to use the ratio when you price a home
- Pull recent sales of similar homes in the same area and price range.
- Calculate two ratios for each: sale to final list price, and sale to original list price.
- Note the days on market next to each one.
- Look at the spread. If original-price ratios are much lower than final-price ratios, sellers in that segment have been overpricing.
- Check the most recent window. Compare the last month or two to the longer period.
- Price from the evidence. Use the ratio to understand how buyers treat asking prices, then set a list price that the recent sales support.
A good ratio is the result of good pricing. It is not something you can fix after the fact by cutting the list price until the math looks nice.
If you are a seller, the most useful question to ask your agent is simple: what did homes like mine sell for compared to where they started, and how long did it take? The answer to that question is worth more than any single percentage on a flyer.
Key takeaways
- Sale-to-list ratio is sale price divided by list price.
- NAR's 2025 profile found a median of 99% of list price.
- A good ratio matches or beats similar local homes right now.
- Final-list ratios can hide price cuts. Check the original list price too.
- Appraisers can use the ratio to estimate where a listing will likely close.
People also ask
Is a sale-to-list ratio over 100% always good?
Not always. It can mean strong demand, or it can mean the home was priced low on purpose. Compare the sale price to similar sales, not only to the list price.
Does the appraiser care about my list price?
The appraiser reviews the listing history, including price changes. But value comes from what similar homes sold for, not from the list or contract price.
Where can I find sale-to-list ratios for my area?
Your agent can calculate them from MLS data for your segment. Public sites like Redfin publish them for larger areas, using final list price.
Sources
Got a question we haven't answered?
Suggest a topic or ask your own appraisal question. The best ones become posts.