Why is a 6-month average already stale when you price a listing?
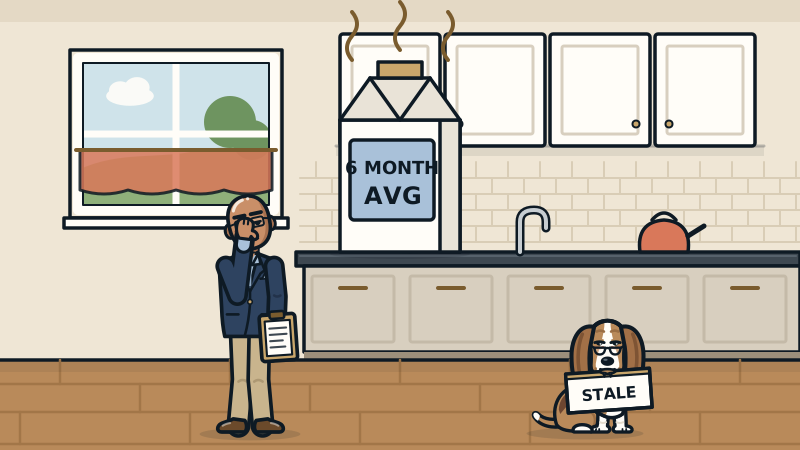
A six-month median is built from closed sales, and each one was negotiated weeks before it closed. Its middle sits about three months back, and a median barely moves until about half its sales come from the new market. Test the 30 and 45 day windows first, and widen only when the data proves you have to.
A six-month median describes a market that already left the room
Pull six months of closed sales, take the median, and price the listing. It is fast, it looks official, and it is the pricing equivalent of checking the weather by reading last spring's newspaper.
Here is the problem in plain arithmetic. A median is the middle sale when you line them all up by price. In a six-month window with a steady pace of sales, the typical sale closed about three months ago. Then add the gap between contract and closing. Redfin's own definition of median sale price counts homes that sold during the period, which means closed. Each of those prices was agreed to weeks before the closing date that put it in your report.
So the six-month median is describing deals that were negotiated roughly three to four months before you price. In a flat market, that is fine. In a market that is turning, you are pricing a house for buyers who already went home.
Medians are stubborn when the market turns
Here is the part most pricing tools never mention. A median does not drift with the market. It sits still until about half of the sales in the window come from the new market, and then it moves all at once.
Take a hypothetical tract of similar homes. For four months, they close around $1,000,000. Then the market softens, and for the last two months they close around $955,000. Every number below is made up to show the math, not taken from a real market.
| Window | Closed sales | Median price |
|---|---|---|
| Last 30 days | 4 | $950,000 |
| Last 45 days | 6 | $955,000 |
| Last 90 days | 12 | $960,000 |
| Last 6 months | 24 | $995,000 |
The six-month median says almost nothing happened. The 45-day window says prices are running about 4% lower. Price off the six-month number and your listing starts life about $40,000 over the market. Then it sits, then it gets cut, then it gets the reputation that comes with both.
With an even pace of sales, a six-month median will not admit the market turned until about three months after it did.
How I test the shortest window the data supports
I pride myself in adjusting in real time. That does not mean grabbing the last two sales and calling it a trend. It means testing the short windows first and showing what they say.
- Start at 30 days, then 45. Count the sales in each. A short window with real sales in it is the freshest read you will ever get.
- Check whether the rungs agree. In the example, 30, 45 and 90 days all point the same way. When short windows agree with each other, a thin one gets stronger.
- If 30 days is too thin, prove it. Show the count and the spread. Four sales that range from a fixer to a remodel tell you nothing on their own. Say so, and say what gives the current read instead.
- Bring in what is happening right now. Pending sales, priced at a predicted close, are deals made this month. So are the sale-to-list ratios and days on market for the most recent closings.
- Widen only when you have to. Move out to 60 or 90 days when the short windows cannot carry the load, and say why.
A lazy six-month average is easy to defend at a listing appointment. It is not always the market.
What appraisers are told about short and long windows
If you think appraisers are stuck with long averages, the rules say otherwise.
For loans sold to Fannie Mae, the Selling Guide requires the market trend in the appraisal to reflect the overall movement of the market based on at least 12 months of data. That is the big picture, and it belongs in the report.
But the guide also warns that a 12-month trend may show prices rising overall while the market was stable, or even declining, during the stretch between a particular comp's contract date and the appraisal date. Each comparable sale gets analyzed from its own contract date forward, and any time adjustment, or the lack of one, has to be supported by evidence.
In other words: the long window tells the story, and the short window sets the price. The same logic works for an agent setting a list price. Show the seller the year so they understand the trend. Price from the most recent window the sales can support, so you do not end up writing the price reduction email in week three.
What I see in the field
The most common pricing miss I see is not a bad comp. It is a good comp from the wrong month. The seller remembers the neighbor's sale from last spring, the six-month search agrees with the seller, and everybody feels great until the open house is quiet.
The second most common miss is the reverse. In a market that is heating up, a long window tells a seller to list below what buyers are already paying. Multiple offers feel like a win, but some of that bidding is the market correcting a list price that was set on old data.
When I build a value, the windows go in the report with their sale counts, so the reader can see the 30-day read next to the six-month one. A number with its evidence next to it is much easier to trust, and much harder to argue with at the kitchen table.
What to do before your next listing appointment
- Run the same search at 30, 45, 90 and 180 days. Put the medians side by side, with the number of sales next to each.
- Watch the leading signals. Sale-to-list ratios slipping below 100%, longer days on market and more price cuts tend to show up before the median moves in the markets I work.
- Read the pendings. Price each one at list times the sale-to-list ratio measured on recent similar sales. It is the closest thing to next month's closed data. Here is how I read pending sales before they close.
- Separate rising from falling. The lag cuts both ways. In a rising market, the six-month median leaves money on the table for your seller.
- Show the seller the ladder. Sellers trust a number more when they can see the 30-day read next to the six-month one and understand why they differ.
If you want that ladder built for a specific property, my Market Intelligence report shows the windows, the sale counts and what each feature is worth, measured from the sales.
Key takeaways
- A six-month median of closed sales reflects deals negotiated roughly three to four months ago.
- Medians barely move until about half the window comes from the new market.
- Test 30 and 45 days first. If a short window is too thin, prove it and say what gives the current read.
- Fannie Mae wants a 12-month trend for context, but each comp is analyzed from its own contract date.
- Pendings priced at a measured sale-to-list ratio are the freshest evidence you have.
Get the best posts once a week.
Priced Right is one email a week with the most useful appraisal and pricing posts and what the market is doing. Never more than one a week. Unsubscribe anytime.
People also ask
How many sales do you need in a 30-day window?
There is no magic count. What matters is whether the sales are similar to the subject and whether the short windows agree with each other. A few closely matched sales that line up with the 45 and 90 day reads say more than a big pile of mixed ones.
Is a six-month average ever the right tool?
Yes, in a slow market with few sales and steady prices, a longer window may be the only reliable read. The point is to test the shorter windows first and show why the longer one is needed.
Does this apply in a rising market too?
Yes. The lag works in both directions. When prices are climbing, a six-month median can price a listing below what buyers are paying today.
Sources
Got a question we haven't answered?
Suggest a topic or ask your own appraisal question. The best ones become posts.